Norwich’s climate action: what we’re doing and where we’re headed.
The Climate Responsive Norwich Programme 2026–2035 is the city’s roadmap for cutting emissions and adapting to climate change.
It brings together all our climate and biodiversity work into one plan, showing how the council will reach net zero by 2030 for its own operations and help the whole city reach net zero by 2045.
Focusing on practical action around buildings, transport, energy, communities and nature, the progaramme aims to ensure Norwich becomes cleaner, healthier and more resilient as the climate changes.
Our climate goals
- net zero council operations by 2030
- net zero Norwich by 2045
- greener parks and open spaces
- helping the city adapt to climate change
Progress so far
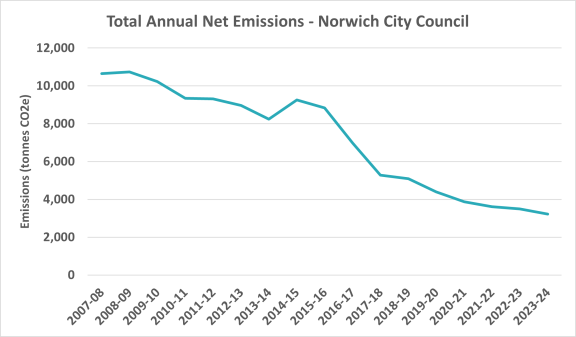
Council emissions
We’ve cut our carbon emissions by nearly 70% since 2007. In 2023/24, our emissions were down to 3,218 tonnes CO₂e - 8% less than the year before.
Key projects:
- £22 million in energy upgrades for council homes (2025–28), including solar panels and heat pumps.
- £5.1 million in grant-funded improvements completed for 260 council homes, adding solar panels and insulation.
- 724 solar panels installed at Riverside Leisure Centre - now powering over a third of the site’s electricity.
- City Hall upgrades with solar panels and a heat pump.
- 100% renewable electricity for all council buildings.
- More solar installations planned on public buildings.
- New emissions tracking starting in 2025 using international standards.
View our carbon footprint reports for 2022/23 and 2023/24.
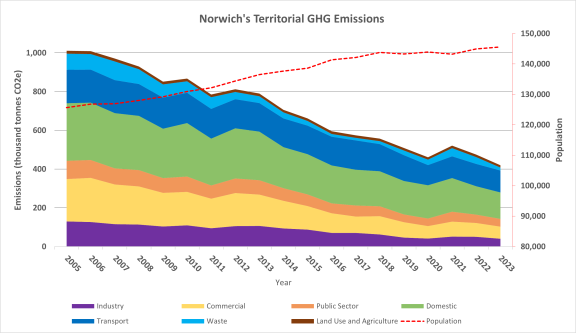
Norwich’s citywide emissions
Norwich produces around 419,700 tonnes of CO2e each year – about 2.9 tonnes per person. Emissions have dropped significantly since 2005, even as the population has grown.
Citywide climate action:
- Leading the Norwich Climate Commission to coordinate efforts.
- Supporting Our Power, a community group helping residents save energy.
- Promoting Solar Together and Big Community Switch to make clean energy affordable.
- Secured £4.7 million to improve energy efficiency in 330 private homes.
- Exploring a Citywide Heat Network to reduce heating emissions.
- Expanding EV charging points with Norfolk County Council.
- Working on climate adaptation, including tree planting and water strategy planning.
What’s next
We’re preparing a new citywide climate action plan to map out how Norwich can reach net zero. Everyone in the city has a role to play - and we’re here to lead and support that journey.
Reports are shared quarterly with our Climate & Environment Emergency Executive Panel (CEEEP). View the latest reports.
